Figure 3
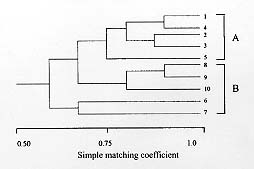
Fig. 3: phenogram showing the similarity among Trypanosoma cruzi isolates. The group A represents the samples from Piauí and the group B the samples from Amazonas.